2.4. Graphics
Graphics make programming more fun for many people. To fully
introduce graphics would involve many ideas that would be a
distraction now. This section introduces a simplified graphics
module developed by John Zelle for use with his Python Programming
book. My slight elaboration of his package is graphics.py in the
example programs.
Warning
You need the file graphics.py in the same folder as
any graphics program you write. Be sure to save
any graphics program you write in such a folder
(like my examples folder). The easiest way
to ensure this is to start in the desired folder,
as discussed in Starting Idle for Editing.
Warning
To work on the most systems, this version of graphics.py cannot be used from the Idle shell. There is an issue with the use of multiple threads of execution.
2.4.1. A Graphics Introduction
Note
You will just be a user of the graphics.py code, so you do
not need to understand the inner workings! It uses all sorts of
features of Python that are way beyond these tutorials. There is
no particular need to open graphics.py in the Idle editor.
Load into Idle and start running example graphIntroSteps.py,
or start running from the operating system folder.
Each time you press return,
look at the screen and read the explanation for the next line(s).
Press return:
from graphics import *
win = GraphWin()
Zelle’s graphics are not a part of the standard Python
distribution. For the Python interpreter to find Zelle’s module, it
must be imported. The first line above makes all the types of object of
Zelle’s module accessible, as if they were already defined like
built-in types str or list.
Look around on your screen, and possibly underneath other windows:
There should be a new window labeled “Graphics Window”, created
by the second line. Bring it
to the top, and preferably drag it around to make it visible beside
your Shell window. A GraphWin is a type of object from Zelle’s
graphics package that automatically displays a window when it is
created. The assignment statement remembers the window object as
win for future reference. (This will be our standard name for
our graphics window object.) A small window, 200 by 200 pixels is
created. A pixel is the smallest little square that can by
displayed on your screen. Modern screen usually have more than 1000
pixels across the whole screen.
Press return:
pt = Point(100, 50)
This creates a Point object and assigns it the name pt.
Unlike when a GraphWin is created,
nothing is immediately displayed:
In theory you could have more than one GraphWin.
Zelle designed the graphics module so you must tell Python into
which GraphWin to draw the Point. A Point object,
like each of the graphical objects that can be drawn on a
GraphWin, has a method [1] draw.
Press return:
pt.draw(win)
Now you should see the Point if you look hard in the Graphics
Window - it shows as a single, small, black pixel. Graphics windows
have a Cartesian (x,y) coordinate system. The dimensions are
initially measured in pixels. The first coordinate is the
horizontal coordinate, measured from left to right, so 100 is about
half way across the 200 pixel wide window. The second coordinate,
for the vertical direction, increases going down from the top of
the window by default, not up as you are likely to expect from
geometry or algebra class. The coordinate 50 out of the total 200
vertically should be about 1/4 of the way down from the top. We
will see later that we can reorient the coordinate system to fit
our taste.
Henceforth you will see a draw method call after each object is created, so there is something to see.
Press return:
cir = Circle(pt, 25)
cir.draw(win)
The first line creates a Circle object with center at the
previously defined pt and with radius 25. This object is
remembered with the name cir. As with all graphics objects that
may be drawn within a GraphWin, it is only made visible by
explicitly using its draw method.
So far, everything has been drawn in the default color black. Graphics objects like a Circle have methods to change their colors. Basic color name strings are recognized. You can choose the color for the circle outline as well as filling in the inside.
Press return:
cir.setOutline('red')
cir.setFill('blue')
Note the method names. They can be used with other kinds of Graphics objects, too. (We delay a discussion of fancier colors until Color Names and Custom Colors.)
Press return:
line = Line(pt, Point(150, 100))
line.draw(win)
A Line object is constructed with two Points as parameters. In this
case we use the previously named Point, pt, and specify another
Point directly. Technically the Line object is a segment between
the the two points.
Warning
In Python (150, 100) is a tuple, not a Point. To make
a Point, you must use the full constructor: Point(150, 100).
Points, not tuples, must be used in the constructors for
all graphics objects.
A rectangle is also specified by two points. The points must be diagonally opposite corners.
Press return:
rect = Rectangle(Point(20, 10), pt)
rect.draw(win)
In this simple system,
a Rectangle is restricted to have horizontal and vertical sides.
A Polygon, introduced in the next section, is used for all more
general straight-sided shapes.
You can move objects around in a GraphWin. Shortly this will be handy for
animation. The parameters to the move method are the
amount to shift the x and y coordinates. See if you can guess the
result before you press return:
line.move(10, 40)
Did you remember that the y coordinate increases down the screen?
Take your last look at the Graphics Window, and make sure that all
the steps make sense. Then destroy the window win with the
GraphWin method close.
Press return:
win.close()
The example program
graphIntro.py
starts with the same graphics code as graphIntoSteps.py,
but without the need for pressing returns.
An addition I have made to Zelle’s package is the ability to print a string value of graphics objects for debugging purposes. If some graphics object isn’t visible because it is underneath something else of off the screen, temporarily adding this sort of output might be a good reality check.
At the end of graphIntro.py,
I added print lines to illustrate the debugging possibilities:
print('cir:', cir)
print('line:', line)
print('rect:', rect)
You can load graphIntro.py into Idle, run it, and add further lines
to experiment if you like. Of course you will not see their effect until
you run the whole program! Unfortunately the graphics do not work when
entered directly into the Shell.
2.4.2. Sample Graphics Programs
In graphIntro.py, a prompt to end the graphics program appeared
in the Shell
window, requiring you to pay attention to two windows.
Instead consider a very simple example program, face.py,
where all the action takes place in the graphics window.
The only interaction is
to click the mouse to close the graphics window.
In Windows, have a folder
window open to the Python examples folder containing face.py,
where your operating system setup may allow you be just
double click on the icon for face.py to run it. If that does not
work on your system, you can always run from inside Idle.
After you have checked out the picture, click with the mouse inside the picture, as requested, to terminate the program.
After you have run the program, you can examine the program in Idle or look below. The whole program is shown first; smaller pieces of it are discussed later:
'''A simple graphics example constructs a face from basic shapes.
'''

from graphics import *


def main():
    win = GraphWin('Face', 200, 150) # give title and dimensions
    win.yUp() # make right side up coordinates!

    head = Circle(Point(40,100), 25) # set center and radius
    head.setFill("yellow")
    head.draw(win)

    eye1 = Circle(Point(30, 105), 5)
    eye1.setFill('blue')
    eye1.draw(win)

    eye2 = Line(Point(45, 105), Point(55, 105)) # set endpoints
    eye2.setWidth(3)
    eye2.draw(win)

    mouth = Oval(Point(30, 90), Point(50, 85)) # set corners of bounding box
    mouth.setFill("red")
    mouth.draw(win)

    label = Text(Point(100, 120), 'A face')
    label.draw(win)

    message = Text(Point(win.getWidth()/2, 20), 'Click anywhere to quit.')
    message.draw(win)
    win.getMouse()
    win.close()

main()
Let us look at individual parts.
Until further notice the set-off code is for you to read and have explained.
from graphics import *
Immediately after the documentation string, always have the import line in your graphics program, to allow easy access to the graphics.py module.
win = GraphWin('Face', 200, 150) # give title and dimensions
win.yUp() # make right side up coordinates!
The first line shows the more general parameters for constructing a
new GraphWin, a window title plus width and height in pixels. The second
line shows how to turn the coordinate system right-side-up, so the
y coordinate increases up the screen, using the yUp method.
(This is one of my additions to Zelle’s graphics.)
Thereafter, all coordinates are given in the new
coordinate system. All the lines of code up to
this point in the program are my standard graphics program
starting lines (other than the specific values for the title and
dimensions). You will likely start your programs with similar
code.
head = Circle(Point(40,100), 25) # set center and radius
head.setFill('yellow')
head.draw(win)

eye1 = Circle(Point(30, 105), 5)
eye1.setFill('blue')
eye1.draw(win)
The lines above create two circles, in each case specifying the
centers directly. They are filled in and made visible.
Also note, that because the earlier
win.yUp call put the coordinates in the normal
orientation, the y coordinate, 100 and 105, are above the middle of the
150 pixel high window.
If the code was switched to put the head part second, the eye would become hidden. The most recent thing drawn is on top.
eye2 = Line(Point(45, 105), Point(55, 105)) # set endpoints
eye2.setWidth(3)
eye2.draw(win)
The code above draws and displays a line, and illustrates another
method available to graphics object, setWidth, making a
thicker line.
mouth = Oval(Point(30, 90), Point(50, 85)) # set corners of bounding box
mouth.setFill('red')
mouth.draw(win)
The code above illustrates another kind of graphics object, an Oval
(or ellipse). There are several ways an oval could be specified.
Zelle chose to have you specify the corners of the bounding box
that is just as high and as wide as the oval. This rectangle is
only imagined, not actually drawn. (If you want to see such a
rectangle, create a Rectangle object with the same two Points as
parameters....)
label = Text(Point(100, 120), 'A face')
label.draw(win)
The code above illustrates how a Text object is used to place text
on the window. The parameters to construct the Text object are the
point at the center of the text, and the text string itself.
The exact coordinates for the parts were determined by a number of trial-and-error refinements to the program. An advantage of graphics is that you can see the results of your programming, and make changes if you do not like the results! In this simple system, there is not a good way to predict the dimensions of text on the screen.
The final action is to have the user signal to close the window.
Just as with waiting for keyboard input from input,
it is important to prompt the user before waiting for
a response! In a GraphWin, that means using prompt must be made with
a Text object displayed explicitly before the response is expected.
message = Text(Point(win.getWidth()/2, 20), 'Click anywhere to quit.')
message.draw(win)
win.getMouse()
win.close()
The new addition to the Text parameters here is win.getWidth()
to obtain the window width.
(There is also a win.getHeight().)
Using win.getWidth()/2 means the horizontal position is set up to be
centered, half way across the window’s width.
After the first two lines draw the prompting text, the line
win.getMouse() waits for a mouse click. In this program, the
position of the mouse click is not important.
(In the next example the position of
this mouse click will be used.) As you have seen before,
win.close() closes the graphics window.
While our earlier text-based Python programs have automatically
terminated after the last line finishes executing, that is not true
for programs that create new windows: The graphics window must be
explicitly closed. The win.close() is necessary.
We will generally want to prompt the user to finally close the
graphics window. Because such a sequence is so common, I have
added another method for Zelle’s GraphWin objects, promptClose,
so the last four lines can be reduced to
win.promptClose(win.getWidth()/2, 20)
where the only specific data needed is the coordinates of the center of the prompt.
The modified program is in face2.py.
You can copy the form of this program for other simple programs
that just draw a picture. The size and title on the window will
change, as well as the specific graphical objects, positions, and
colors. Something like the last line can be used to terminate
the program.
Warning
If you write a program with a bug, and the program bombs out while there is a GraphWin on the screen, a dead GraphWin lingers. The best way to clean things up is to make the Shell window be the current window and select from the menu .
Another simple drawing example is balloons.py. Feel free to run
it and look at the code in Idle. Note that the steps for the
creation of all three balloons are identical, except for the
location of the center of each balloon, so a loop over a list of
the centers makes sense.
The next example, triangle.py, illustrates similar starting and
ending code. In addition it explicitly interacts with the user.
Rather than the code specifying literal coordinates for all
graphical objects, the program remembers
the Points where the user clicked the mouse.
They are used as the vertices of a
triangle.
Return to the directory window for the Python examples. In Windows
you may be able to double click on the icon for triangle.py to run it.
Or on a Mac, you can run it using the Python Launcher, rather than Idle.
While running the program, follow the prompts in the graphics window and click with the mouse as requested.
After you have run the program, you can examine the program in Idle or look below:
'''Program: triangle.py or triangle.pyw (best name for Windows)
Interactive graphics program to draw a triangle,
with prompts in a Text object and feedback via mouse clicks.
'''

from graphics import *

def main():
    win = GraphWin('Draw a Triangle', 350, 350)
    win.yUp() # right side up coordinates
    win.setBackground('yellow')
    message = Text(Point(win.getWidth()/2, 30), 'Click on three points')
    message.setTextColor('red')
    message.setStyle('italic')
    message.setSize(20)
    message.draw(win)

    # Get and draw three vertices of triangle
    p1 = win.getMouse()
    p1.draw(win)
    p2 = win.getMouse()
    p2.draw(win)
    p3 = win.getMouse()
    p3.draw(win)
    vertices = [p1, p2, p3]

    # Use Polygon object to draw the triangle
    triangle = Polygon(vertices)
    triangle.setFill('gray')
    triangle.setOutline('cyan')
    triangle.setWidth(4)  # width of boundary line
    triangle.draw(win)

    message.setText('Click anywhere to quit') # change text message
    win.getMouse()
    win.close()

main()
Let us look at individual parts.
The lines before the new line:
win.setBackground('yellow')
are standard starting lines (except for the specific values chosen for the width, height, and title). The background color is a property of the whole graphics window that you can set.
message = Text(Point(win.getWidth()/2, 20), 'Click on three points')
message.setTextColor('red')
message.setStyle('italic')
message.setSize(20)
message.draw(win)
Again a Text object is created. This is the prompt for user action.
These lines illustrate most of the ways the appearance of a Text
object may be
modified, with results like in most word processors. The reference pages
for graphics.py give the details. This reference is introduced shortly in
The Documentation for graphics.py.
After the prompt, the program looks for a response:
# Get and draw three vertices of triangle
p1 = win.getMouse()
p1.draw(win)

p2 = win.getMouse()
p2.draw(win)

p3 = win.getMouse()
p3.draw(win)
The win.getMouse() method (with no parameters), waits for you
to click the mouse inside win. Then the Point where the
mouse was clicked is returned. In this code three mouse clicks
are waited for, remembered in variables p1, p2, and p3,
and the points are drawn.
Next we introduce a very versatile type of graphical object, a
Polygon, which may have any number of vertices specified in a
list as its parameter. We see that the methods setFill and
setOutline that we used earlier on a Circle, and the
setWidth method we used for a Line, also apply to a
Polygon, (and also to other graphics objects).
vertices = [p1, p2, p3]
triangle = Polygon(vertices)
triangle.setFill('gray')
triangle.setOutline('cyan')
triangle.setWidth(4)
triangle.draw(win)
Besides changing the style of a Text object, the text itself may be changed:
message.setText('Click anywhere to quit')
Then lines responding to this prompt:
win.getMouse()
win.close()
If you want to use an existing Text object to display the quitting prompt, as I did here, I provide a variation on my window closing method that could replace the last three lines:
win.promptClose(message)
An existing Text object may be given as parameter rather than coordinates
for a new text object. The complete code with that substitution is in
triangle2.py.
If you want to make regular polygons or stars, you need some trigonometry,
not required for this tutorial, but you can see its use in example
polygons.py.
2.4.3. A Windows Operating System Specialization: .pyw
This Windows-specific section is not essential. It does describe how to make some Windows graphical programs run with less clutter.
If you ran the triangle.py program by double clicking its icon
under Windows, you might have noticed a console window first
appearing, followed by the graphics window. For this program, there
was no keyboard input or screen output through the console window,
so the console window was unused and unnecessary. In such cases,
under Windows, you can change the source file extension from .py to
.pyw, suppressing the display of the console window. If you are
using Windows, change the filename triangle.py to triangle.pyw,
double click on the icon in its directory folder, and check it out.
The distinction is irrelevant inside Idle, which always has its Shell window.
2.4.4. Graphics.py vs. Event Driven Graphics
This optional section only looks forward to more elaborate graphics systems than are used in this tutorial.
One limitation of the graphics.py module is that it is not robust
if a graphics window is closed by clicking on the standard
operating system close button on the title bar. If you close a
graphics window that way, you are likely to get a Python error
message. On the other hand, if your program creates a graphics
window and then terminates abnormally due to some other error,
the graphics window may be left orphaned. In this case the close
button on the title bar is important: it is the easiest method to
clean up and get rid of the window!
This lack of robustness is tied to the simplification designed into
the graphics module. Modern graphics environments are
event driven. The program can be interrupted by input from many
sources including mouse clicks and key presses. This style of
programming has a considerable learning curve. In Zelle’s graphics
package, the complexities of the event driven model are pretty well
hidden. If the programmer wants user input, only one type can be
specified at a time (either a mouse click in the graphics window
via the getMouse method, or via the input keyboard
entry methods into the Shell window).
2.4.5. The Documentation for graphics.py
Thus far various parts of Zelle’s graphics package have been introduced by example. A systematic reference to Zelle’s graphics package with the form of all function calls is at http://mcsp.wartburg.edu/zelle/python/graphics/graphics/index.html. We have introduced most of the important concepts and methods.
One special graphics input object type, Entry, will be
discussed later. You might skip it for now. Another section of the
reference that will not be pursued in the tutorials is the
Image class.
Meanwhile you can look at http://mcsp.wartburg.edu/zelle/python/graphics/graphics/index.html. It is important to pay attention to the organization of the reference: Most graphics object share a number of common methods. Those methods are described together, first. Then, under the headings for specific types, only the specialized additional methods are discussed.
The version for this Tutorial has a few elaborations. Here is all their documentation together:
- GraphWin method yUp (y increases upward)
When you first create a GraphWin, the y coordinates increase down the screen. To reverse to the normal orientation use my GraphWin yUp method.
win = Graphwin('Right side up', 300, 400)
win.yUp()
- GraphWin method promptClose (Prompt and Close Graphics Window)
You generally want to continue displaying your graphics window until the user chooses to have it closed. The GraphWin promptClose method posts a prompt, waits for a mouse click, and closes the GraphWin. There are two ways to call it, depending on whether you want to use an existing Text object, or just specify a location for the center of the prompt.
win.promptClose(win.getWidth()/2, 30) # specify x, y coordinates of prompt
or
msg = Text(Point(100, 50), 'Original message...')
msg.draw(win)
# ...
# ... just important that there is a drawn Text object
win.promptClose(msg)  # use existing Text object
- String Representations of all Graphics Object Types
Each graphical type can be converted to a string or printed, and a descriptive string is produced (for debugging purposes). It only shows position, not other parts of the state of the object.
>>> pt = Point(30, 50)
>>> print(pt)
Point(30, 50)
>>> ln = Line(pt, Point(100, 150))
>>> print(ln)
Line(Point(30, 50), Point(100, 150))
2.4.5.1. Scene Exercise
Make a program scene.py creating a scene with the graphics
methods. You are likely to need to adjust the positions of objects
by trial and error until you get the positions you want.
Make sure you have graphics.py in the same directory as your program.
2.4.5.2. Changing Scene Exercise
Elaborate the scene program above so it becomes changeScene.py,
and changes one or more times when you click the mouse (and use
win.getMouse()). You may use the position of the mouse click to
affect the result, or it may just indicate you are ready to go on
to the next view.
2.4.6. Issues with Mutable Objects
Zelle chose to have the constructor for a Rectangle take diagonally
opposite corner points as parameters. Suppose you prefer to specify
only one corner and also specify the width and height of the
rectangle. You might come up with the following function,
makeRect, to return such a new Rectangle. Read the following
attempt:
def makeRect(corner, width, height):
    '''Return a new Rectangle given one corner Point and the dimensions.'''
    corner2 = corner
    corner2.move(width, height)
    return Rectangle(corner, corner2)
The second corner must be created to use in the Rectangle
constructor, and it is done above in two steps. Start corner2
from the given corner and shift it by the dimensions of the
Rectangle to the other corner. With both corners specified, you can
use Zelle’s version of the Rectangle constructor.
Unfortunately this is an incorrect argument. Run the example
program makeRectBad.py:
'''Program: makeRectBad.py
Attempt a function makeRect (incorrectly),
which takes a takes a corner point and dimensions to construct a Rectangle.
'''

from graphics import *

def makeRect(corner, width, height):  # Incorrect!
    '''Return a new Rectangle given one corner Point and the dimensions.'''
    corner2 = corner
    corner2.move(width, height)
    return Rectangle(corner, corner2)

def main():
    win = GraphWin('Draw a Rectangle (NOT!)', 300, 300)
    win.yUp()

    rect = makeRect(Point(20, 50), 250, 200)
    rect.draw(win)

    win.promptClose(win.getWidth()/2, 20)

main()
By stated design, this program should draw a rectangle with one
corner at the point (20,50) and the other corner at
(20+250,50+200) or the point (270,250), and so the rectangle should take
up most of the 300 by 300 window. When you run it however that is
not what you see. Look carefully. You should just see one Point
toward the upper right corner, where the second corner should be.
Since a Rectangle was being drawn, it looks like it is the
tiniest of Rectangles, where the opposite corners are at the
same point! Hm, well the program did make the corners be the same
initially. Recall we set
corner2 = corner
What happens after that?
Read and follow the details of what happens.
We need to take a much more careful look at what naming an object
means. A good way to visualize this association between a name and
an object is to draw an arrow from the name to the object
associated with it. The object here is a Point, which has an x
and y coordinate describing its state, so when the makeRect
method is started the parameter name corner is associated with
the actual parameter, a Point with coordinates (20, 50).

Next, the assignment statement associates the name corner2 with
the same object. It is another name, or alias, for the original
Point.

The next line,
corner2.move(width, height)
internally changes or mutates the Point object, and since in
this case width is 250 and height is 200, the coordinates of the
Point associated with the name corner2 change to 20+250=270
and 50+200=250:

Look! The name corner is still associated with the same object,
but that object has changed internally! That is the problem: we
wanted to keep the name corner associated with the point with
original coordinates, but it has been modified.
The solution is to use the clone method that is defined for all
the graphical objects in graphics.py. It creates a separate
object, which is a copy with an equivalent state. We just need to
change the line
corner2 = corner
to
corner2 = corner.clone()
A diagram of the situation after the cloning is:

Though corner and corner2 refer to points with equivalent
coordinates, they do not refer to the same object. Then after
corner2.move(width, height)
we get:

No conflict: corner and corner2 refer to the corners we
want. Run the corrected example program, makeRectangle.py.
2.4.7. More on Mutable and Immutable Types
Read this section if you want a deeper understanding of the significance of mutable and immutable objects.
This alias problem only came up because a Point is mutable. We
had no such problems with the immutable types int or str.
Read and follow the discussion of the following code.
Just for comparison, consider the corresponding diagrams for code
with ints that looks superficially similar:
a = 2
b = a
b = b + 3
After the first two lines we have an alias again:

The third line does not change the int object 2. The result of the
addition operation refers to a different object, 5, and the name
b is assigned to it:
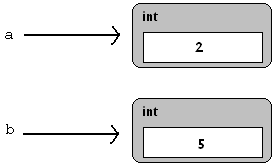
Hence a is still associated with the integer 2 - no conflict.
It is not technically correct to think of b as being the
number 2, and then 5, but a little sloppiness of thought does not
get you in trouble with immutable types. With mutable types,
however, be very careful of aliases. Then it is very important to
remember the indirectness: that a name is not the same thing as the
object it refers to.
Another mutable type is list. A list can be cloned with the
slice notation: [:]. Try the following in the Shell: [2]
nums = [1, 2, 3]
numsAlias = nums
numsClone = nums[:]
nums.append(4)
numsAlias.append(5)
nums
numsAlias
numsClone
2.4.8. Animation
Run the example program, backAndForth0.py. The whole program is shown below for convenience. Then each individual new part of the code is discussed individually:
'''Test animation and depth.
'''

from graphics import *
import time

def main():
    win = GraphWin('Back and Forth', 300, 300)
    win.yUp() # make right side up coordinates!

    rect = Rectangle(Point(200, 90), Point(220, 100))
    rect.setFill("blue")
    rect.draw(win)

    cir1 = Circle(Point(40,100), 25)
    cir1.setFill("yellow")
    cir1.draw(win)

    cir2 = Circle(Point(150,125), 25)
    cir2.setFill("red")
    cir2.draw(win)

    for i in range(46):
        cir1.move(5, 0)
        time.sleep(.05)

    for i in range(46):
        cir1.move(-5, 0)
        time.sleep(.05)

    win.promptClose(win.getWidth()/2, 20)

main()
Read the discussion below of pieces of the code from the program above. Do not try to execute fragments alone.
There are both an old and a new form of import statement:
from graphics import *
import time
The program uses a function from the time module. The syntax used
for the time module is actually the safer and more typical way to
import a module. As you will see later in the program, the
sleep function used from the time module will be referenced
as time.sleep(). This tells the Python interpreter to look in
the time module for the sleep function.
If we had used the import statement
from time import *
then the sleep function could just be referenced with
sleep(). This is obviously easier, but it obscures the fact
that the sleep function is not a part of the current module.
Also several modules that a program imports might have functions
with the same name. With the individual module name prefix, there
is no ambiguity. Hence the form import moduleName is actually
safer than from moduleName import *.
You might think that all modules could avoid using any of the same function names with a bit of planning. To get an idea of the magnitude of the issue, have a look at the number of modules available to Python. Try the following in the in the Shell (and likely wait a number of seconds):
help('modules')
Without module names to separate things out, it would be very hard to totally avoid name collisions with the enormous number of modules you see displayed, that are all available to Python!
Back to the current example program: The main program starts with standard window creation, and then makes three objects:
rect = Rectangle(Point(200, 90), Point(220, 100))
rect.setFill('blue')
rect.draw(win)

cir1 = Circle(Point(40,100), 25)
cir1.setFill('yellow')
cir1.draw(win)

cir2 = Circle(Point(150,125), 25)
cir2.setFill('red')
cir2.draw(win)
Zelle’s reference pages do not mention the fact that the order in
which these object are first drawn is significant. If objects
overlap, the ones which used the draw method later appear on top.
Other object methods like setFill or move do not alter
which are in front of which. This becomes significant when cir1
moves. The moving cir1 goes over the rectangle and behind
cir2. (Run the program again if you missed that.)
The animation starts with the code for a simple repeat loop:
for i in range(46):  # animate cir1 to the right
    cir1.move(5, 0)
    time.sleep(.05)
This very simple loop animates cir1 moving in a straight line
to the right. As in a movie, the illusion of continuous motion is
given by jumping only a short distance each time (increasing the
horizontal coordinate by 5). The time.sleep function, mentioned
earlier, takes as parameter a time in seconds to have the program
sleep, or delay, before continuing with the iteration of the loop.
This delay is important, because modern computers are so fast, that
the intermediate motion would be invisible without the delay. The
delay can be given as a decimal, to allow the time to be a fraction
of a second.
The next three lines are almost identical to the previous lines, and move the circle to the left (-5 in the horizontal coordinate each time).
for i in range(46):  # animate cir1 to the left
    cir1.move(-5, 0)
    time.sleep(.05)
The next example program, backAndForth1.py, it just a slight variation, looking to the user just like the last version. Only the small changes are shown below. This version was written after noticing how similar the two animation loops are, suggesting an improvement to the program: Animating any object to move in a straight line is a logical abstraction well expressed via a function.
The loop in the initial version of the program contained a number
of arbitrarily chosen constants, which make sense to turn into
parameters. Also, the object to be animated does not need to be
cir1, it can be any of the drawable objects in the graphics
package. The name shape is used to make this a parameter:
def moveOnLine(shape, dx, dy, repetitions, delay):
    for i in range(repetitions):
        shape.move(dx, dy)
        time.sleep(delay)
Then in the main function the two similar animation loops are reduced to a line for each direction:
moveOnLine(cir1, 5, 0, 46, .05)
moveOnLine(cir1, -5, 0, 46, .05)
Make sure you see these two lines with function calls behave the same way as the two animation loops in the main program of the original version.
Run the next example version, backAndForth2.py. The changes are more substantial here, and the display of the whole program is followed by display and discussion of the individual changes:
'''Test animation of a group of objects making a face.
'''

from graphics import *
import time

def moveAll(shapeList, dx, dy):
    ''' Move all shapes in shapeList by (dx, dy).'''
    for shape in shapeList:
        shape.move(dx, dy)


def moveAllOnLine(shapeList, dx, dy, repetitions, delay):
    '''Animate the shapes in shapeList along a line.
    Move by (dx, dy) each time.
    Repeat the specified number of repetitions.
    Have the specified delay (in seconds) after each repeat.
    '''
    for i in range(repetitions):
        moveAll(shapeList, dx, dy)
        time.sleep(delay)


def main():
    win = GraphWin('Back and Forth', 300, 300)
    win.yUp() # make right side up coordinates!

    rect = Rectangle(Point(200, 90), Point(220, 100))
    rect.setFill("blue")
    rect.draw(win)

    head = Circle(Point(40,100), 25)
    head.setFill("yellow")
    head.draw(win)

    eye1 = Circle(Point(30, 105), 5)
    eye1.setFill('blue')
    eye1.draw(win)

    eye2 = Line(Point(45, 105), Point(55, 105))
    eye2.setWidth(3)
    eye2.draw(win)

    mouth = Oval(Point(30, 90), Point(50, 85))
    mouth.setFill("red")
    mouth.draw(win)

    faceList = [head, eye1, eye2, mouth]

    cir2 = Circle(Point(150,125), 25)
    cir2.setFill("red")
    cir2.draw(win)

    moveAllOnLine(faceList, 5, 0, 46, .05)
    moveAllOnLine(faceList, -5, 0, 46, .05)

    win.promptClose(win.getWidth()/2, 20)

main()
Read the following discussion of program parts.
Moving a single elementary shape is rather limiting. It is much
more interesting to compose a more complicated combination, like
the face from the earlier example face.py. To animate such a
combination, you cannot use the old moveOnLine function,
because we want all the parts to move together, not one eye all
the way across the screen and then have the other eye catch up! A
variation on moveOnLine is needed where all the parts move
together. We need all the parts of the face to move one step,
then sleep once, and all move again, sleep once, ....
This could all be coded in a single
method, but there are really two ideas here:
- Moving a group of objects one step.
- Animating a number of moves for the group.
This suggests two functions. Another issue is how to handle a group
of elementary graphics objects. The most basic combination of
objects in Python is a list, so we assume a parameter
shapeList, which is a list of elementary graphics objects.
For the first function, moveAll, just move all the objects in
the list one step. Since we assume a list of objects and we want
to move each, this suggests a for-each loop:
def moveAll(shapeList, dx, dy):
    ''' Move all shapes in shapeList by (dx, dy).'''
    for shape in shapeList:
        shape.move(dx, dy)
Having this function, we can easily write the second function
moveAllOnLine, with a simple change from the moveOnLine
function, substituting the moveAll function for the line with
the move method:
def moveAllOnLine(shapeList, dx, dy, repetitions, delay):
    '''Animate the shapes in shapeList along a line.
    Move by (dx, dy) each time.
    Repeat the specified number of repetitions.
    Have the specified delay (in seconds) after each repeat.
    '''
    for i in range(repetitions):
        moveAll(shapeList, dx, dy)
        time.sleep(delay)
The code in main to construct the face is the same as in the
earlier example face.py. Once all the pieces are constructed
and colored, they must be placed in a list, for use in
moveAllOnLine:
faceList = [head, eye1, eye2, mouth]
Then, later, the animation uses the faceList to make the face
go back and forth:
moveAllOnLine(faceList, 5, 0, 46, .05)
moveAllOnLine(faceList, -5, 0, 46, .05)
This version of the program has encapsulated and generalized the moving and animating by creating functions and adding parameters that can be substituted. Again, make sure you see how the functions communicate to make the whole program work. This is an important and non-trivial use of functions.
In fact all parts of the face do not actually move at once: The moveAll loop code moves each part of the face separately, in sequence. Depending on your computer setup, all the parts of the face may appear to move together. Again, the computer is much faster than our eyes. On a computer that repaints the screen fast enough, the only images we notice are the ones on the screen when the animation is sleeping.
Note
On a fast enough computer you can make many consecutive changes to an image before the next sleep statement, and they all appear to happen at once in the animation.
Optional refinement: Not
all computers are set up for the same graphics speed in Python. One machine that
I use animates backAndForth2.py quite well. Another seems to have the
mouth wiggle. On the latter sort of machine, during animation it is useful not to have
visible screen changes for every individual move. Instead you can explicitly tell the
computer when it is the right time to redraw the screen. The computer can store
changes and then update the screen. Withholding updates is controlled
by win.autoflush. It starts as True, but can be changed to False before animation.
When set to False, you must call update() every time you want the screen
refreshed. That is going to be just before the time.sleep() in an animation.
In backAndForth2Update.py this is illustrated, with moveAllOnLine replaced by
moveAllOnLineUpdate:
                             #NEW update version, added win param
def moveAllOnLineUpdate(shapeList, dx, dy, repetitions, delay, win):
    '''Animate the shapes in shapeList along a line in win.
    Move by (dx, dy) each time.
    Repeat the specified number of repetitions.
    Have the specified delay (in seconds) after each repeat.
    '''
    win.autoflush = False          # NEW: set before animation
    for i in range(repetitions):
        moveAll(shapeList, dx, dy)
        update()         # NEW needed to make all the changes appear
        time.sleep(delay)
    win.autoflush = True           # NEW: set after animation
Run the next example program backAndForth3.py.
The final version, backAndForth3.py and its variant,
backAndForth3Update.py, use the observation that
the code to make a face embodies one unified idea, suggesting
encapsulation inside a function. Once you have encapsulated the
code to make a face, we can make several faces! Then the problem
with the original code for the face is that all the positions for
the facial elements are hard-coded: The face can only be drawn in
one position. The full listing of backAndForth3.py below
includes a makeFace function with a parameter for the position
of the center of the face.
Beneath the listing of the whole program is a discussion of the individual changes:
'''Test animation of a group of objects making a face.
Combine the face elements in a function, and use it twice.
Have an extra level of repetition in the animation.

This version may be wobbly and slow on some machines:
Then see backAndForthFlush.py.
'''

from graphics import *
import time

def moveAll(shapeList, dx, dy):
    ''' Move all shapes in shapeList by (dx, dy).'''
    for shape in shapeList:
        shape.move(dx, dy)


def moveAllOnLine(shapeList, dx, dy, repetitions, delay):
    '''Animate the shapes in shapeList along a line.
    Move by (dx, dy) each time.
    Repeat the specified number of repetitions.
    Have the specified delay (in seconds) after each repeat.
    '''
    for i in range(repetitions):
        moveAll(shapeList, dx, dy)
        time.sleep(delay)


def makeFace(center, win):
    '''display face centered at center in window win.
    Return a list of the shapes in the face.
    '''

    head = Circle(center, 25)
    head.setFill("yellow")
    head.draw(win)

    eye1Center = center.clone() # face positions are relative to the center
    eye1Center.move(-10, 5)     # locate further points in relation to others
    eye1 = Circle(eye1Center, 5)
    eye1.setFill('blue')
    eye1.draw(win)

    eye2End1 = eye1Center.clone()
    eye2End1.move(15, 0)
    eye2End2 = eye2End1.clone()
    eye2End2.move(10, 0)

    eye2 = Line(eye2End1, eye2End2)
    eye2.setWidth(3)
    eye2.draw(win)

    mouthCorner1 = center.clone()
    mouthCorner1.move(-10, -10)
    mouthCorner2 = mouthCorner1.clone()
    mouthCorner2.move(20, -5)

    mouth = Oval(mouthCorner1, mouthCorner2)
    mouth.setFill("red")
    mouth.draw(win)

    return [head, eye1, eye2, mouth]

def main():
    win = GraphWin('Back and Forth', 300, 300)
    win.yUp() # make right side up coordinates!

    rect = Rectangle(Point(200, 90), Point(220, 100))
    rect.setFill("blue")
    rect.draw(win)

    faceList = makeFace(Point(40, 100), win)
    faceList2 = makeFace(Point(150,125), win)

    stepsAcross = 46
    dx = 5
    dy = 3
    wait = .05
    for i in range(3):
        moveAllOnLine(faceList, dx, 0, stepsAcross, wait)
        moveAllOnLine(faceList, -dx, dy, stepsAcross//2, wait)
        moveAllOnLine(faceList, -dx, -dy, stepsAcross//2, wait)

    win.promptClose(win.getWidth()/2, 20)

main()
Read the following discussion of program parts.
As mentioned above, the face construction function allows a parameter to specify where the center of the face is. The other parameter is the GraphWin that will contain the face.
def makeFace(center, win):
then the head is easily drawn, using this center, rather than the previous
cir1 with its specific center point (40, 100):
head = Circle(center, 25)
head.setFill('yellow')
head.draw(win)
For the remaining Points used in the construction there is the
issue of keeping the right relation to the center. This is
accomplished much as in the creation of the second corner point in
the makeRectangle function in Section Issues with Mutable Objects. A
clone of the original center Point is made, and then moved by the
difference in the positions of the originally specified
Points. For instance, in the original face, the center of the
head and first eye were at (40, 110) and (30, 115) respectively.
That means a
shift between the two coordinates of (-10, 5), since 30-40 = -10
and 130-110 = 20.
eye1Center = center.clone() # face positions are relative to the center
eye1Center.move(-10, 5)     # locate further points in relation to others
eye1 = Circle(eye1Center, 5)
eye1.setFill('blue')
eye1.draw(win)
The only other changes to the face are similar, cloning and moving
Points, rather than specifying them with explicit coordinates.
eye2End1 = eye1Center.clone()
eye2End1.move(15, 0)
eye2End2 = eye2End1.clone()
eye2End2.move(10, 0)
eye2 = Line(eye2End1, eye2End2)
eye2.setWidth(3)
eye2.draw(win)

mouthCorner1 = center.clone()
mouthCorner1.move(-10, -10)
mouthCorner2 = mouthCorner1.clone()
mouthCorner2.move(20, -5)
mouth = Oval(mouthCorner1, mouthCorner2)
mouth.setFill('red')
mouth.draw(win)
Finally, the list of elements for the face must be returned to the caller:
return [head, eye1, eye2, mouth]
Then in the main function, the program creates a face in exactly
the same place as before, but using the makeFace function, with
the original center of the face Point(40, 100) as parameter. Now with the
makeFace function, with its center parameter, it is also easy
to replace the old cir2 with a whole face!
faceList = makeFace(Point(40, 100), win)
faceList2 = makeFace(Point(150,125), win)
The animation section is considerably elaborated in this version.
stepsAcross = 46
dx = 5
dy = 3
wait = .01
for i in range(3):
    moveAllOnLine(faceList, dx, 0, stepsAcross, wait)
    moveAllOnLine(faceList, -dx, dy, stepsAcross//2, wait)
    moveAllOnLine(faceList, -dx, -dy, stepsAcross//2, wait)
The unidentified numeric literals that were used before are replaced by named values that easily identify the meaning of each one. This also allows the numerical values to be stated only once, allowing easy modification.
The whole animation is repeated three times by the use of a simple
repeat loop. Since moveAllOnLine has a for-loop inside it,
it illustrates nesting of loops.
The animations in the loop body illustrate that the straight line of motion does not need to be horizontal. The second and third lines use a non-zero value of both dx and dy for the steps, and move diagonally.
Make sure you see now how the whole program works together, including all the parameters for the moves in the loop.
By the way, the documentation of the functions in a module you have just run in the Shell is directly available. Try in the Shell:
help(moveAll)
2.4.8.1. Nose in Face Exercise
* Save backAndForth3.py or backAndForth3Update.py
to the new name backAndForth4.py.
Add a triangular nose in the middle of the face in the makeFace
function. Like the other features of the face, make sure the
position of the nose is relative to the center parameter. Make
sure the nose is included in the final list of elements of the face
that get returned!
2.4.8.2. Faces Exercise
* Make a program faces.py that asks the user to click
the mouse, and then draws a face at the point where the user
clicked. Copy the makeFace function definition
from the previous exercise, and use it!
Elaborate this with a Simple Repeat Loop, so this is repeated six times:
After each of 6 mouse clicks, a face immediately appears at the location of the latest
click. Think how you can reuse your code each time through the loop!
2.4.8.3. Moving Faces Exercise
* Animate two faces moving in different directions
at the same time in a program move2Faces.py. You cannot use
the moveAllOnLine function. You will have to make a variation
of your own. You can use the moveAll function separately for
each face.
Hint: imagine the old way of making an animated cartoon. If each face was on a separate piece of paper, and you wanted to animate them moving together, you would place them separately, record one frame, move them each a bit toward each other, record another frame, move each another bit toward each other, record another frame, .... In our animations “record a frame” is replaced by a short sleep to make the position visible to the user. Make a loop to incorporate the repetition of the moves.
2.4.9. Entry Objects
(Optional section) Read this section if you want to allow the user to enter text directly into a graphics window.
When using a graphics window, the shell window is still available.
Keyboard input can be done in the normal text fashion, waiting for
a response, and going on after the user presses the Enter key. It
is annoying to make a user pay attention to two windows, so the
graphics module provides a way to enter text inside a graphics
window, with the Entry type. The entry is a partial
replacement for the input function.
Run the simple example, greet.py, which is copied below:
"""Simple example with Entry objects.
Enter your name, click the mouse, and see greetings.
"""

from graphics import *

def main():
    win = GraphWin("Greeting", 300, 300)
    win.yUp()

    instructions = Text(Point(win.getWidth()/2, 40),
                     "Enter your name.\nThen click the mouse.")
    instructions.draw(win)

    entry1 = Entry(Point(win.getWidth()/2, 200),10)
    entry1.draw(win)

    Text(Point(win.getWidth()/2, 230),'Name:').draw(win) # label for the Entry

    win.getMouse()  # To know the user is finished with the text.

    name = entry1.getText()

    greeting1 = 'Hello, ' + name + '!'
    Text(Point(win.getWidth()/3, 150), greeting1).draw(win)

    greeting2 = 'Bonjour, ' + name + '!'
    Text(Point(2*win.getWidth()/3, 100), greeting2).draw(win)

    win.promptClose(instructions)

main()
The only part of this with new ideas is:
entry1 = Entry(Point(win.getWidth()/2, 200),10)
entry1.draw(win)
Text(Point(win.getWidth()/2, 230),'Name:').draw(win) # label for the Entry

win.getMouse()  # To know the user is finished with the text.
name = entry1.getText()
The first line of this excerpt creates an Entry object, supplying its center point and a number of characters to leave space for (10 in this case).
As with other places where input is requested, a separate static label is added.
The way the underlying events are hidden in graphics.py, there is
no signal when the user is done entering text in an Entry box.
To signal the program, a mouse press is used above. In this case
the location of the mouse press is not relevant, but once the mouse
press is processed, execution can go on and read the Entry text.
The method name getText is the same as that used with a Text
object.
Run the next example, addEntries.py, also copied below:
"""Example with two Entry objects and type conversion.
Do addition.
"""

from graphics import *

def main():
    win = GraphWin("Addition", 300, 300)
    win.yUp()

    instructions = Text(Point(win.getWidth()/2, 30),
                     "Enter two numbers.\nThen click the mouse.")
    instructions.draw(win)

    entry1 = Entry(Point(win.getWidth()/2, 250),25)
    entry1.setText('0')
    entry1.draw(win)

    Text(Point(win.getWidth()/2, 280),'First Number:').draw(win)

    entry2 = Entry(Point(win.getWidth()/2, 180),25)
    entry2.setText('0')
    entry2.draw(win)

    Text(Point(win.getWidth()/2, 210),'Second Number:').draw(win)

    win.getMouse()  # To know the user is finished with the text.

    numStr1 = entry1.getText()
    num1 = int(numStr1)

    numStr2 = entry2.getText()
    num2 = int(numStr2)
    sum = num1 + num2

    result = "The sum of\n{num1}\nplus\n{num2}\nis {sum}.".format(**locals())
    Text(Point(win.getWidth()/2, 110), result).draw(win)

    win.promptClose(instructions)

main()
As with the input
statement, you can only read strings from an Entry.
With conversions, it is still possible to work with numbers.
Only one new graphical method has been included above:
entry1.setText('0')
Again the same method name is used as with a Text object. In
this case I chose not to leave the Entry initially blank. The 0
value also reinforces that a numerical value is expected.
There is also an entry2 with almost identical code. After
waiting for a mouse click, both entries are read, and the chosen
names emphasizes they are strings. The strings must be converted to
integers in order to do arithmetic and display the result.
The almost identical code for the two entries is a strong
suggestion that this code could be written more easily with a
function. You may look at the identically functioning example
program addEntries2.py. The only changes are shown below. First
there is a function to create an Entry and a centered static label
over it.
def makeLabeledEntry(entryCenterPt, entryWidth, initialStr, labelText, win):
    '''Return an Entry object with specified center, width in characters, and
    initial string value.  Also create a static label over it with
    specified text.  Draw everything in the GraphWin win.
    '''

    entry = Entry(entryCenterPt, entryWidth)
    entry.setText(initialStr)
    entry.draw(win)
    labelCenter = entryCenterPt.clone()
    labelCenter.move(0, 30)
    Text(labelCenter,labelText).draw(win)
    return entry
In case I want to make more Entries with labels later, and refer to this code again, I put some extra effort in, making things be parameters even if only one value is used in this program. The position of the label is made 30 units above the entry by using the clone and move methods. Only the Entry is returned, on the assumption that the label is static, and once it is drawn, I can forget about it. Since I do not refer later to the Text object, I do not bother to name it, but just draw it immediately.
Then the corresponding change in the main function is just two calls to this function:
entry1 = makeLabeledEntry(Point(win.getWidth()/2, 250), 25,
                          '0', 'First Number:', win)
entry2 = makeLabeledEntry(Point(win.getWidth()/2, 180), 25,
                          '0', 'Second Number:', win)
These lines illustrate that a statement may take more than one line. In particular, as in the Shell, Python is smart enough to realize that there must be a continuation line if the parentheses do not match.
While I was improving things, I also changed the conversions to integers. In the first version I wanted to emphasize the existence of both the string and integer data as a teaching point, but the num1Str and num2Str variables were only used once, so a more concise way to read and convert the values is to eliminate them:
num1 = int(entry1.getText())
num2 = int(entry2.getText())
2.4.10. Color Names
Thus far we have only used common color names. In fact there are a very large number of allowed color names, and also the ability to draw with custom colors.
First, the graphics package is built on an underlying graphics system, Tkinter, which has a large number of color names defined. Each of the names can be used by itself, like ‘red’, ‘salmon’ or ‘aquamarine’ or with a lower intensity by specifying with a trailing number 2, 3, or 4, like ‘red4’ for a dark red.
Though the ideas for the coding have not all been introduced, it is
still informative to run the example program colors.py. As you
click the mouse over and over, you see the names and appearances of
a wide variety of built-in color names. The names must be place in
quotes, but capitalization is ignored.
2.4.11. Custom Colors
Custom colors can also be created. To do that requires some
understanding of human eyes and color (and the Python tools). The
only colors detected directly by the human eyes are red, green, and
blue. Each amount is registered by a different kind of cone cell in
the retina. As far as the eye is concerned, all the other colors we
see are just combinations of these three colors. This fact is used
in color video screens: they only directly display these three
colors. A common scale to use in labeling the intensity of each of
the basic colors (red, green, blue) is from 0 to 255, with 0
meaning none of the color, and 255 being the most intense. Hence a
color can be described by a sequence of red, green, and blue
intensities (often abbreviated RGB). The graphics package has a
function, color_rgb, to create colors this way. For instance a
color with about half the maximum red intensity, no green, and
maximum blue intensity would be
aColor = color_rgb(128, 0, 255)
Such a creation can be used any place a color is used in the
graphics, (i.e. circle.setFill(aColor)).
2.4.12. Random Colors
Another interesting use of the color_rgb function is to create
random colors. Run example program randomCircles.py. The code
also is here:
"""Draw random circles.
"""
from graphics import *
import random, time

def main():
    win = GraphWin("Random Circles", 300, 300)
    for i in range(75):
        r = random.randrange(256)
        b = random.randrange(256)
        g = random.randrange(256)
        color = color_rgb(r, g, b)

        radius = random.randrange(3, 40)
        x = random.randrange(5, 295)
        y = random.randrange(5, 295)

        circle = Circle(Point(x,y), radius)
        circle.setFill(color)
        circle.draw(win)
        time.sleep(.05)

    win.promptClose(win.getWidth()/2, 20)

main()
Read the fragments of this program and their explanations:
To do random things, the program needs a function from the random module. This example shows that imported modules may be put in a comma separated list:
import random, time
You have already seen the built-in function range. To generate
a sequence of all the integers 0, 1, ... 255, you would use
range(256)
This is the full list of possible values for the red, green or blue
intensity parameter. For this program we randomly choose any one
element from this sequence. Instead of the range function, use
the random module’s randrange function, as in
r = random.randrange(256)
b = random.randrange(256)
g = random.randrange(256)
color = color_rgb(r, g, b)
This gives randomly selected values to each of r, g, and
b, which are then used to create the random color.
I want a random circle radius, but I do not want a number as small
as 0, making it invisible. The range and randrange
functions both refer to a possible sequence of values starting with
0 when a single parameter is used. It is also possible to add a
different starting value as the first parameter. You still must
specify a value past the end of the sequence. For instance
range(3, 40)
would refer to the sequence 3, 4, 5, ... , 39 (starting with 3
and not quite reaching 40). Similarly
random.randrange(3, 40)
randomly selects an arbitrary element of range(3, 40).
I use the two-parameter version to select random parameters for a Circle:
radius = random.randrange(3, 40)
x = random.randrange(5, 295)
y = random.randrange(5, 295)

circle = Circle(Point(x,y), radius)
What are the smallest and largest values I allow for x and y? [3]
Random values are often useful in games.
2.4.12.1. Ranges Exercise
Write a program ranges.py in three parts.
(Test after each added part.)
This problem is not a graphics program. It is just a regular text program to illustrate your understanding of ranges and loops.
For simplicity each of the requested number sequences can just be printed with
one number per line. Print a label for each number sequence before you print
the sequence, like Numbers 1-4, Numbers 1-n,
Five random numbers in 1-n.
- First use the range function and a for-loop to produce the sequence 1, 2, 3, 4, and then print the numbers, one number per line.
- Prompt the user to input an integer n and print the sequence 1, 2, 3, ... , n - including n, using a for-loop. Hint: [4]
- Use a Simple Repeat Loop to find and print five randomly chosen numbers from the range 1, 2, 3, ... , n. Use the same value of n that the user chose earlier in the program. It should be possible that the number n is printed sometimes.
2.4.12.2. Text Triangle Exercise
* Write a program texttriangle.py.
This, too, is not a graphics program.
Prompt the user for a small positive integer value, that I’ll call n.
Then use a for-loop with a range function call to make a triangular
arrangement of ‘#’characters, with n ‘#’ characters in the last line.
Hint: [5]
Then leave a blank line. Then make a similar
triangle, except start with the line with n ‘#’ characters.
To make the second triangle, you can use a for-loop of the form
discussed so far, but that is trickier than looking ahead to
The Most General range Function
and using a for-loop
where a range function call has a negative step size.
Here is the screen after a posible run with user input 4:
Enter a small positive integer: 4
#
##
###
####

####
###
##
#
And another possible run with user input 2:
Enter a small positive integer: 2
#
##

##
#
| [1] | The basic ideas of objects and methods were introduced in Object Orientation. |
| [2] | Actually, lists are even trickier, because individual elements of a
list may be mutable: Each mutable
element in the cloned list is an alias of the corresponding element
in the original list, so if you mutate its state in the cloned list,
you also make a change to the original list. This is distinct
from the situation if you replace an
element in the cloned list by a totally different one: then you do not
change the original list. |
| [3] | 5 and 294 (one less than 295). |
| [4] | If 4 or n is the last number, what is the first number past the end of the sequence? |
| [5] | A row of ‘#’ characters is easiest if you remember the string multiplication operator *. |